August 12, 2026
CO2 Enrichment in Commercial Cannabis


Supplemental CO₂ is one of the few inputs in indoor cultivation that reliably increases yield, and it is one of the easiest to spend money on without ever collecting that yield. It only works when carbon is the thing limiting the crop, which means light, climate and irrigation have to be right first. It also pushes the room toward a humidity range that favors bud rot, so on the humidity side it is the disease ceiling, not the VPD target, that should pick your setpoint.
Setpoints by stage
Everything below assumes a sealed room. CO₂ by stage, keyed to the light level that makes it worth spending:
| Stage | PPFD (µmol·m⁻²·s⁻¹) | CO₂ target (ppm) | Why |
|---|---|---|---|
| Clones and rooting | Under 400 | 420 | Light-limited canopy, so extra carbon has nowhere to go. Hold ambient as a floor, do not enrich |
| Veg | 400–600 | 800–1,000 | Useful, but the return is smaller than in flower |
| Flower, weeks 1–6 | 900 and up | 1,000–1,200 | The window that pays for the system |
| Final 7–10 days | 900 and up | Taper to ambient, schedule below | Densest, highest-risk window for bud rot; hold the humidity ceiling hardest here |
The floor underneath all of it is light. Enrichment does very little below roughly 800 PPFD PPFD Photosynthetic photon flux density: the number of photons from 400 to 700 nanometers reaching one square meter each second, expressed in µmol·m⁻²·s⁻¹. , because a light-limited canopy is not short of carbon in the first place. Fix PPFD, or the daily light integral Daily light integral (DLI) The total photosynthetically active photons reaching one square meter over a day, expressed in mol·m⁻²·d⁻¹. DLI combines light intensity with duration. behind it, before spending anything on gas.
Climate that goes with those setpoints
| Setting | Ambient, around 420 ppm | Enriched, 1,000–1,200 ppm |
|---|---|---|
| CO₂, lights on | Whatever the outside and the crew provide, drifting down through the day | Held at 1,000–1,200 ppm by injection and a controller |
| Canopy temperature | 76–78 °F (24–26 °C) | 82–85 °F (28–29 °C). The one that is not optional |
| Relative humidity | Around 62% to sit at 1.2 kPa at 77 °F (25 °C) | 62–68%, held under the disease ceiling |
| Leaf VPD target | 1.0–1.4 kPa | 1.3–1.4 kPa, the dry end, chosen for disease risk rather than growth |
| Transpiration | Baseline | Down roughly 29%, stomatal conductance down roughly 42% |
| Substrate dryback | The rate your steering program was built around | Slower, because dryback is driven by transpiration |
| Irrigation and calcium | Tuned to the old dryback rate | Re-tuned. Watch that daily volume and calcium delivery do not fall |
| Air exchange | Exhaust and vent freely to manage heat and humidity | Sealed. Mini-splits and dehumidification do the climate work |
| Lights off | Nothing to do | Injection at zero, no carbon is fixed in the dark |
| Monitoring | Optional | Hardwired CO₂ monitor, audible alarm, written evacuation protocol |
Injection runs from 15 to 30 minutes after lights on until 60 to 90 minutes before lights off, and sits at zero overnight. The VPD Vapor pressure deficit The difference between saturation vapor pressure and actual water-vapor pressure. Leaf-to-air VPD is one driver of transpiration, moderated by stomata and water supply. target is the one line worth restating: the general 1.0 to 1.4 kPa range still applies, but in an enriched room disease risk picks the end of it, and the end you want is the dry one. Above roughly 70 percent relative humidity Relative humidity The share of moisture air is holding against the most it could hold at that temperature. Because it moves with temperature, cooling air raises RH with no water added. you are in the range botrytis Botrytis cinerea The fungus behind bud rot, also called gray mold. Its spores germinate in prolonged leaf wetness at high humidity, at roughly 55 to 75 °F (13 to 24 °C). prefers (Mahmoud et al., 2023). Dryback Dryback The decrease in a growing substrate's water content between irrigation events, commonly tracked as a change in volumetric water content. slows too, so re-baseline the substrate curves before trusting any steering decision.
The relative humidity figures in these tables are calculated from the VPD target rather than measured, using the Magnus equation Magnus equation An empirical equation that estimates saturation vapor pressure from temperature. Magnus-form coefficients are fitted to measured vapor-pressure data. with leaf temperature taken as equal to the temperature of the surrounding room. That assumption holds better under enrichment than at ambient.
Rebuild the humidity column for your own canopy temperature and VPD in the VPD and dew point calculator.
Before you turn the gas on
In order. Each one is what makes the next worth doing.
- Seal the room. Mini-splits and dehumidification do the climate work. If you are exhausting during injection, you are buying CO₂ for the neighborhood.
- Get PPFD above 800 at canopy height, measured on a grid rather than assumed from fixture specs.
- Get humidity control working with the dehumidification capacity to hold
62 to 68 percentat82 to 85 °F (28 to 29 °C). - Put the CO₂ monitoring in first, before the first injection rather than after. Specifics in Safety, below.
- Raise canopy temperature and CO₂ together, on the same day. Not the gas first and the thermostat sometime later.
- Re-baseline drybacks once the gas is running, before making any generative or vegetative call.
Why it works
Cannabis is a C3 plant C3 photosynthesis The photosynthetic pathway used by cannabis and most plant species, named for the three-carbon compound formed when carbon dioxide first enters the Calvin cycle. , which is the whole reason supplemental carbon does anything. In a C3 plant, carbon dioxide is captured directly by RuBisCO RuBisCO The enzyme that begins carbon fixation by adding carbon dioxide to RuBP. It can also react with oxygen, initiating photorespiration. , and that enzyme carries a flaw: it strongly prefers carbon dioxide, but oxygen is roughly 25 to 30 times more abundant than carbon dioxide at its catalytic site, so the enzyme still grabs oxygen a meaningful share of the time.
When it grabs carbon the reaction is carboxylation Carboxylation The reaction in which Rubisco adds carbon dioxide to ribulose-1,5-bisphosphate, beginning carbon fixation in the Calvin cycle. and the plant gains sugar. When it grabs oxygen instead, the plant runs photorespiration Photorespiration A carbon-recycling pathway initiated when Rubisco reacts with oxygen instead of carbon dioxide, consuming energy and releasing some previously fixed carbon. , a salvage pathway that burns energy and hands back carbon it had already fixed. At the roughly 420 ppm Parts per million (ppm) A concentration ratio meaning one part of a substance per million parts of the mixture, abbreviated ppm. The exact interpretation depends on what is being measured. outside, a real share of a cannabis plant's photosynthetic capacity goes out this way. Raising CO₂ in a sealed room tilts the competition at the enzyme toward carbon, photorespiration falls, and net photosynthesis Net photosynthesis The rate at which a leaf gains carbon through photosynthesis after subtracting carbon released by respiration and photorespiration. rises.
The second consequence matters more than most growers expect. With more carbon available, the plant can meet its needs with its stomata Stomata Microscopic pores in the plant epidermis, each controlled by guard cells, that regulate carbon dioxide entry and water-vapor loss. less far open. Stomatal conductance Stomatal conductance A measure of how readily carbon dioxide and water vapor pass through a leaf's stomata, reflecting pore opening and the gas-exchange capacity of the leaf surface. falls, transpiration Transpiration Water moving up through the plant and evaporating out through the stomata. It drives nutrient uptake, and carries calcium, which moves almost entirely by that flow. falls with it, and water use efficiency Water use efficiency (WUE) The amount of carbon gained or biomass produced relative to water used. Its numerical meaning depends on whether it is measured at a leaf, plant, or crop scale. climbs. That one change drives most of the section below.
What changes when the gas goes on
CO₂ is not a setting you bolt onto an existing recipe. It changes the plant's water relations, and climate and irrigation have to move with it.
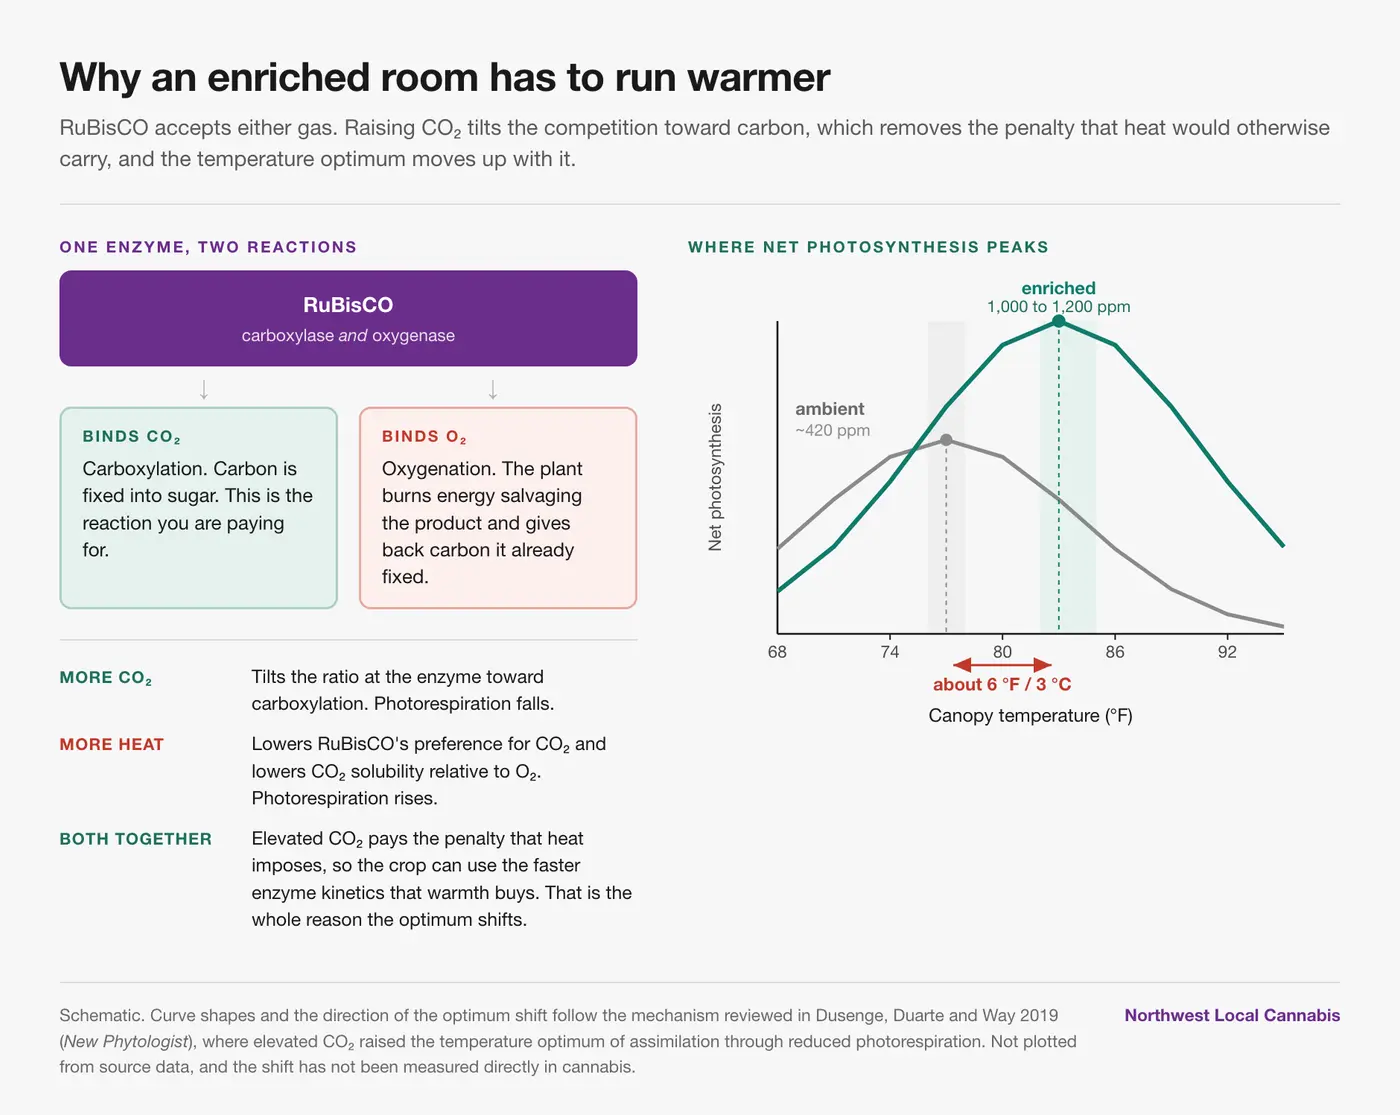
Canopy temperature: 76 to 78 °F (24 to 26 °C) becomes 82 to 85 °F (28 to 29 °C)
What to do. Move the canopy setpoint up by about 6 °F (3 °C), on the same day the gas comes on.
Why. Photorespiration gets worse as temperature rises, which is the main reason conventional rooms settle at 76 to 78 °F (24 to 26 °C): push warmer without extra carbon and you lose more to the oxygenation reaction than you gain from faster enzyme kinetics. Elevated CO₂ removes that penalty. With photorespiration suppressed, the temperature at which net photosynthesis peaks moves up, and the crop can finally use the speed that warmth buys. The mechanism is reviewed across C3 species by Dusenge, Duarte and Way (2019), though the exact size of the shift has not been measured directly in cannabis.
What it costs to skip. Running 1,200 ppm at 76 °F (24 °C) is the single most common reason enrichment underperforms. The gas gets bought, the thermostat never moves, and most of the benefit stays in the tank.
Relative humidity: up, but disease risk sets the ceiling
What to do. Hold VPD at the dry end of the range, 1.3 to 1.4 kPa, which puts relative humidity at 62 to 68 percent anywhere in the 82 to 85 °F (28 to 29 °C) band. Do not let the VPD math walk you up to 70 percent and above.
Why humidity has to rise at all. Warmer conditions hold more moisture, so the same VPD at a higher temperature takes a higher relative humidity. At 77 °F (25 °C), 1.2 kPa works out to roughly 62 percent. At 84 °F (29 °C) the same 1.2 kPa needs roughly 70 percent. Rooms that raise temperature while holding the old humidity setpoint end up running the canopy far drier than intended, which is its own problem.
What too dry actually costs. Hold 62 percent while the room sits at 84 °F (29 °C) and the canopy is seeing about 1.5 kPa, not the 1.3 to 1.4 you meant to run. The dial never moved; the temperature moved underneath it. Stomata close against a gradient that steep, and under enrichment they are already part closed, so the two effects stack. That throttles CO₂ uptake, which is the one thing the gas was bought to increase, so the room pays for enrichment and then shuts the door the carbon comes through. The tells are leaf edges cupping upward, growth flattening, and irrigation demand climbing while the root zone struggles to keep pace. None of which argues for a wetter room: dry is still the safer direction to miss in, because the wet miss is bud rot. The error is drifting past the range, not sitting at the dry end of it.
One thing that gets easier. Dehumidification load falls, since the plant is transpiring less and the target itself allows more moisture in the room. The equipment problem is smaller under enrichment, not larger.
What the warmer room does to disease risk
The temperature change works in your favor here. The humidity change works against you. Running the dry end of the VPD band is how you keep both.
At 1.3 to 1.4 kPa the whole band clears it. Every temperature from 82 to 85 °F (28 to 29 °C) lands between 62 and 68 percent, under the threshold at every point, and the dew point runs 68 to 73 °F (20 to 23 °C). That is the entire humidity argument for enrichment: the warmer room is safer from bud rot while the lights are on, and the dry end of the band is what keeps the night from giving it back.
Dryback slows down
What to do. Re-baseline your substrate moisture curves after the gas comes on, before you trust any generative or vegetative decision.
Why. In a coco coir Coco coir A coconut-husk growing substrate. It holds little nutrient charge of its own, so it is fed every irrigation and reacts fast to changes in temperature or EC. or rockwool Rockwool A mineral-fiber growing substrate formed by spinning molten rock into fibers and shaping them into propagation plugs, blocks, or slabs. drain to waste Drain-to-waste An irrigation strategy where runoff is discarded rather than recirculated. Runoff readings become the main window into what the root zone is doing. system, dryback is driven by transpiration. Cut transpiration by roughly a quarter and the substrate takes longer to give up its water. If your crop steering Crop steering The deliberate use of irrigation, root-zone conditions and climate to influence the balance between vegetative and reproductive growth. strategy is built on hitting a target dryback percentage before the first shot of the day, enrichment shifts that timeline underneath you without announcing itself.
What it does to the crop. A room that was steering generatively at a given shot size and frequency can drift vegetative once transpiration drops, which puts growth into leaf and stem rather than flower. That is the opposite of what the gas was bought for.
Calcium delivery falls
What to do. Watch total daily irrigation volume, and calcium in particular. Feed EC Electrical conductivity (EC) A measure of a solution's ability to carry electric current, used as a fast indicator of total dissolved ion concentration but not of any specific nutrient. unchanged does not mean calcium delivered unchanged.
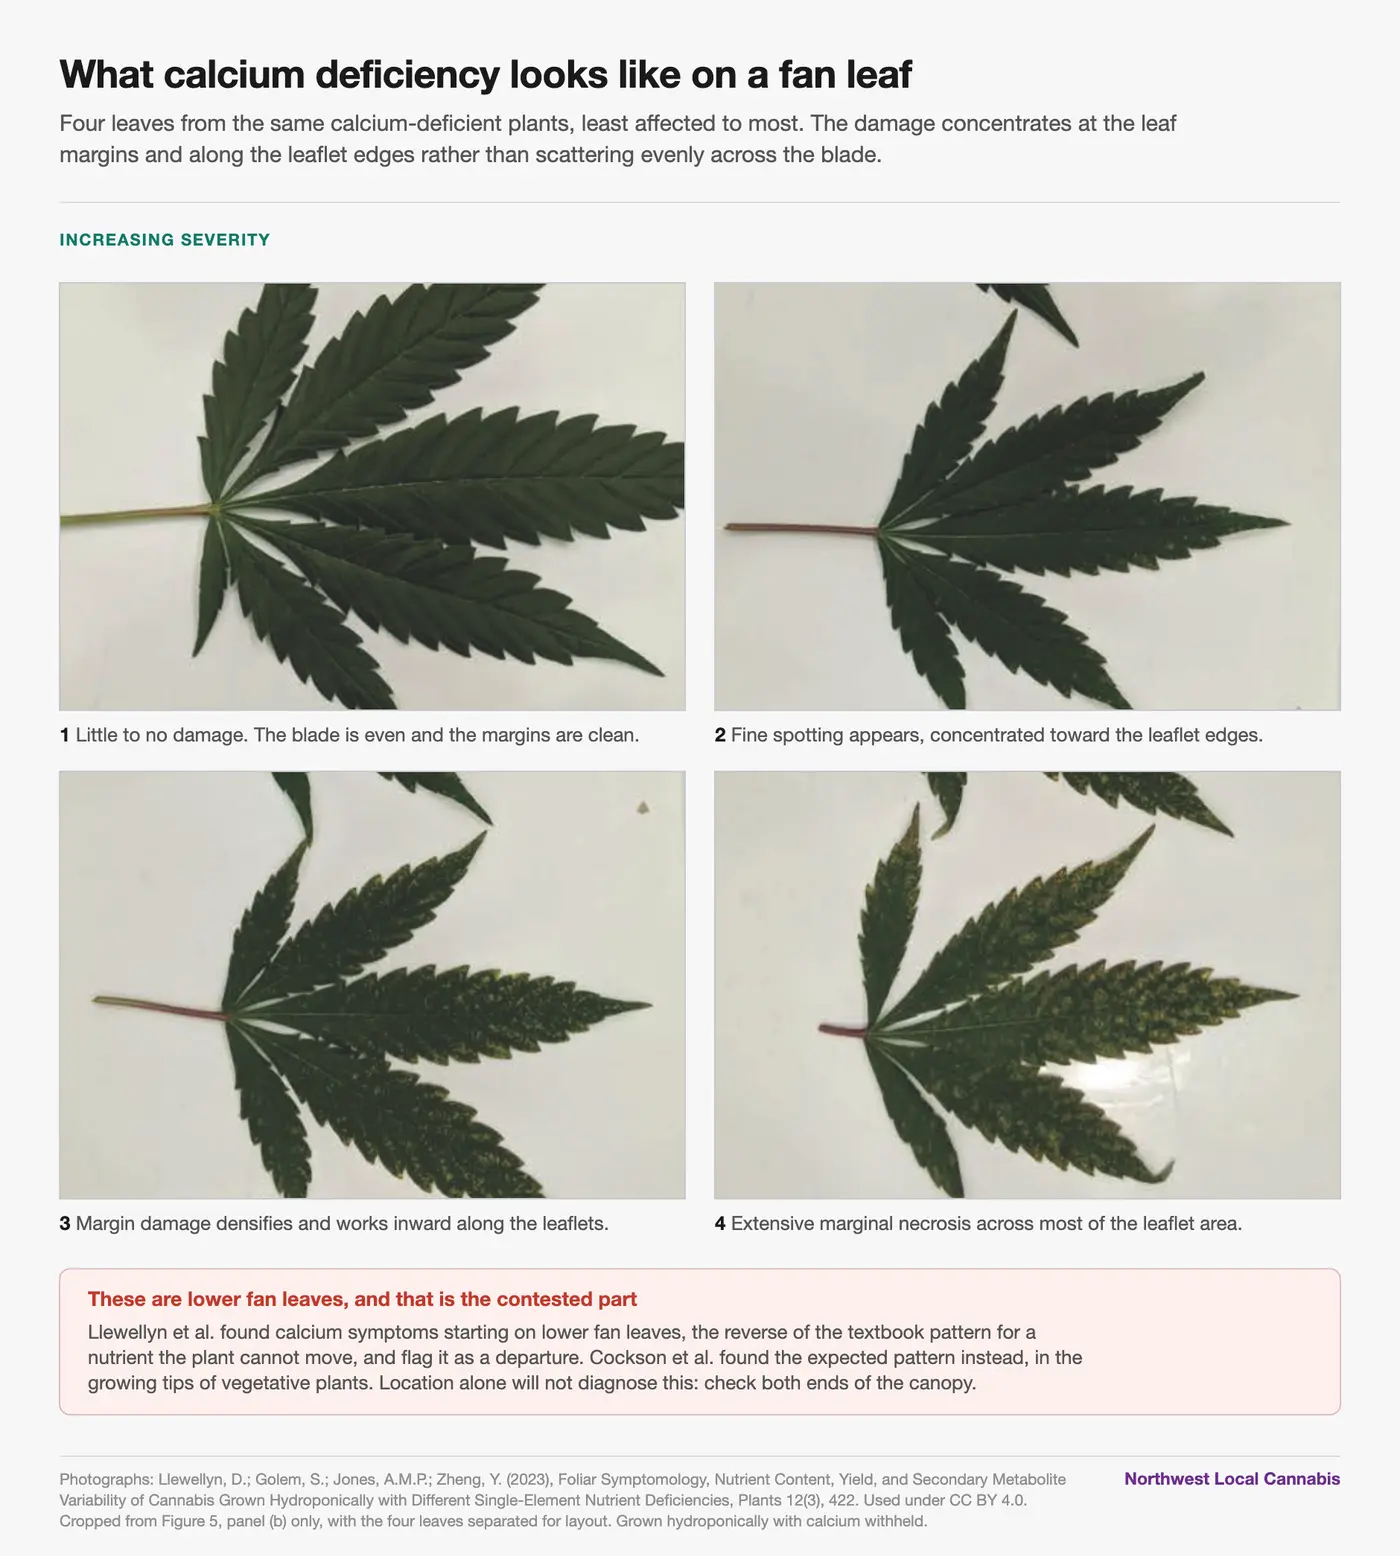
Why. Calcium reaches the leaf by mass flow Mass flow The movement of dissolved nutrients with bulk water toward a root surface. Transpiration and water uptake help maintain this flow through the root zone. , carried along with water. It has almost no phloem Phloem Living vascular tissue that transports sugars and other compounds from source tissues to growing, storing, or metabolically active sink tissues. mobility, so it depends on transpiration to get where it is going. Less water moved means less calcium delivered.
Where it shows is less settled than it looks. The textbook answer is the newest, fastest-expanding tissue, and Cockson et al. (2019) found exactly that in vegetative plants: stunted growing tips and marginal necrosis on newly expanding leaves. Llewellyn et al. (2023) found the reverse in flowering plants, with margin necrosis starting on lower fan leaves and only reaching the upper canopy two weeks later. They call it a departure from how calcium normally behaves, and their tissue tests make it stranger still: the symptomatic lower leaves held about three times the calcium of the clean upper canopy. Two studies, two patterns. Location alone will not diagnose this, so check both ends of the canopy and confirm with tissue or runoff testing.
Daily schedule
Injection tracks the photoperiod Photoperiod The duration and timing of light and darkness in a repeating daily cycle. Photoperiod-sensitive cannabis uses night length as a flowering signal. , because carbon is only fixed while the lights are on.
| When | Action | Why |
|---|---|---|
| Lights on plus 15–30 min | Begin injection | Stomata need time to open before the plant can take up anything |
| Through the photoperiod | Hold the setpoint | Carbon is only fixed while the lights are on |
| Lights off minus 60–90 min | Cut injection | Uptake is winding down, so gas injected now is largely wasted |
| Overnight | Zero | Plants do not fix carbon in the dark |
Tapering out at the end of flower
The table above covers a single day. The last 7 to 10 days need the other axis, because injection and canopy temperature have to come down together. The 82 to 85 °F (28 to 29 °C) setpoint is only defensible while the extra carbon is suppressing photorespiration, so a room still held at 85 °F (29 °C) once the gas is back to ambient is paying the photorespiratory cost with nothing offsetting it. That is worse than either setting on its own. Count the schedule back from harvest rather than from a week number, so it does not assume a cycle length. The schedule ends at ambient rather than at zero, and in a sealed room the distinction matters. A full canopy under full light pulls CO₂ down on its own, so switching injection off does not hold the room at ambient: it takes the room below ambient, toward the CO₂ compensation point CO₂ compensation point The carbon dioxide concentration at which a leaf's photosynthetic uptake equals its carbon loss through respiration and photorespiration, producing zero net exchange. where photorespiration hands back what the plant fixes. The controller keeps a 420 ppm floor until the lights come off for the last time.
| Days before harvest | CO₂ (ppm) | Canopy temp | Why |
|---|---|---|---|
| Day 10 | 1,000 | 81 °F (27 °C) | First step down. Hold PPFD, the canopy is still filling |
| Day 9 | 1,000 | 80 °F (27 °C) | Injection holds while the room keeps stepping down |
| Day 8 | 800 | 79 °F (26 °C) | Temperature tracks the gas so photorespiration never runs unopposed |
| Day 7 | 800 | 78 °F (26 °C) | Gas held, the ramp continues underneath it |
| Day 6 | 650 | 77 °F (25 °C) | Return on injection is falling as the canopy ripens |
| Day 5 | 650 | 76 °F (24 °C) | Ripening continues, injection unchanged |
| Day 4 | 500 | 75 °F (24 °C) | Transpiration and dryback come back toward the ambient rate |
| Day 3 | 500 | 74 °F (23 °C) | The last step down, the room is nearly ambient |
| Day 2 | 420 | 73 °F (23 °C) | Ambient held by injection. Switching it off in a sealed room takes the canopy below ambient |
| Day 1 | 420 | 73 °F (23 °C) | Still held, the room is at its finish climate |
| Day 0 | 420 | 73 °F (23 °C) | Harvest day |
Where these numbers come from
The measured cannabis work is Chandra et al. (2008), who put Cannabis sativa in a gas exchange system across a range of light levels, temperatures and CO₂ concentrations. At 750 ppm, which the paper writes as 750 µmol·mol⁻¹, they recorded:
| Measure | Change against ambient |
|---|---|
| Net photosynthesis | Up 50% |
| Water use efficiency | Up 111% |
| Transpiration | Down about 29% |
| Stomatal conductance | Down about 42% |
That study's tested range topped out at 750 ppm, and assimilation was still climbing when it got there. It never identifies a saturation point because it never reached one, and it is routinely cited as though it did.
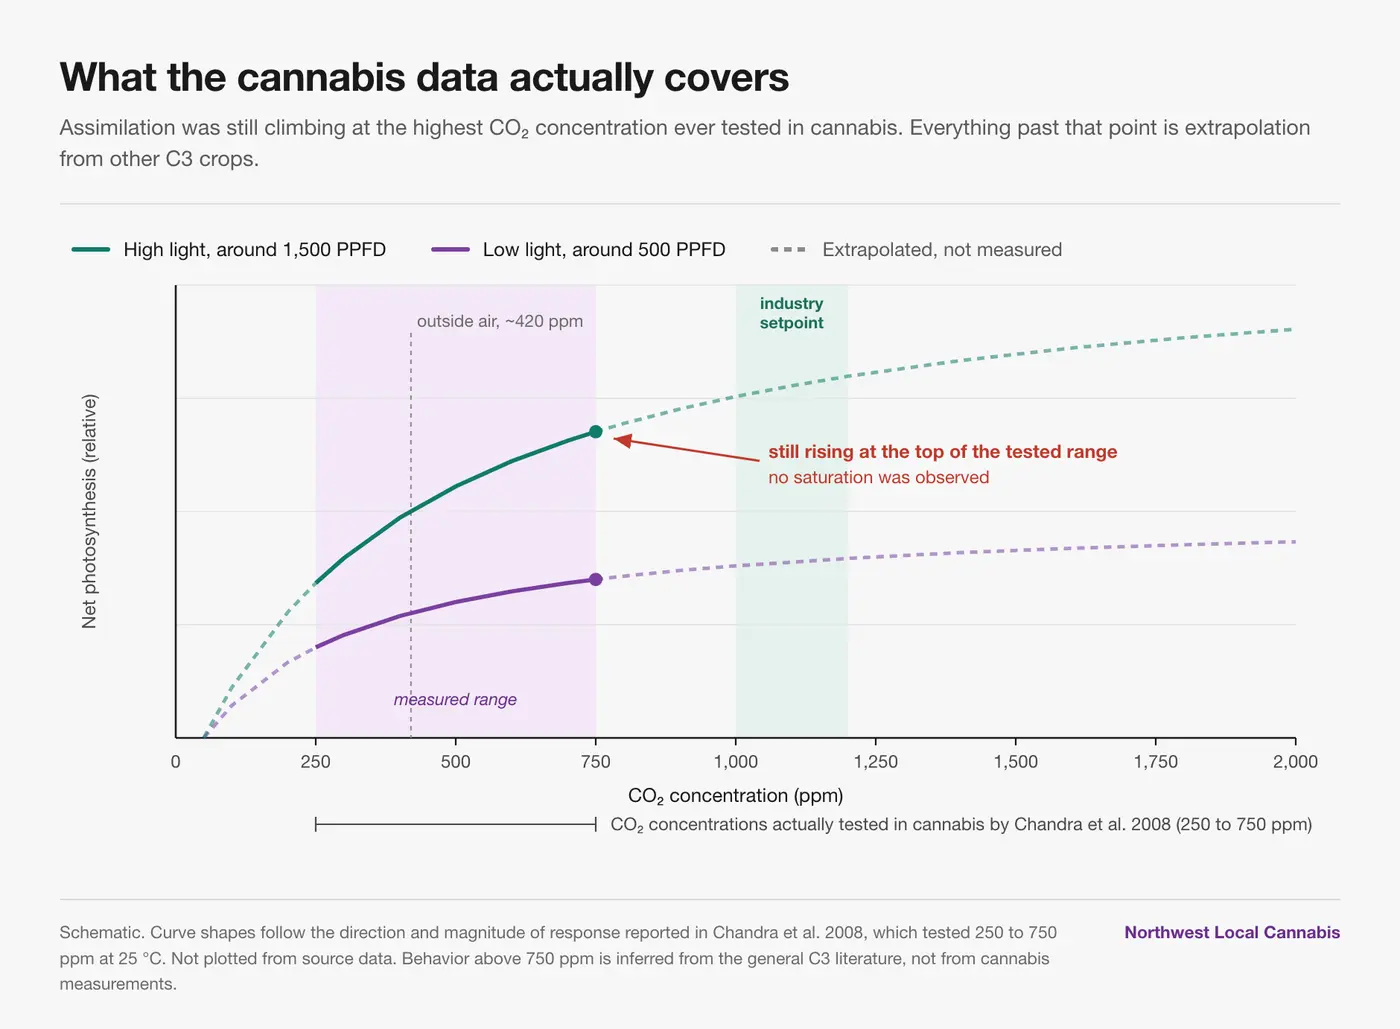
So the familiar 1,000 to 1,200 ppm figure does not come from a published cannabis dose-response curve Dose-response curve A graph showing how a measured response changes across a range of doses or input levels, used to reveal thresholds, useful ranges, and saturation. , because there is not one. It comes from the general C3 literature, the cost of gas, realistic leak rates, and worker safety. It is an economic convention that has held up well in practice, and it is better to say that plainly than to dress it up as a plant science finding.
The temperature shift is the same kind of claim. Dusenge, Duarte and Way review the mechanism across C3 species, so the direction is solid. The size of the shift in cannabis specifically has not been measured.
What the evidence does not cover
- Potency. Enrichment raises grams, not cannabinoid Cannabinoid A member of a chemically related group of compounds found in cannabis, including THC, CBD and CBG, that can interact with biological targets in different ways. concentration. Potency per gram tends to hold flat or dip slightly while total grams go up. Specific yield-lift percentages at specific ppm values circulate widely, but they trace back to vendor copy rather than to a study you can read.
- Anything above 750 ppm. There is no cannabis data either way. What is well established across C3 crops is that the response curve flattens, and that sustained very high CO₂ can trigger photosynthetic acclimation Photosynthetic acclimation A change in photosynthetic capacity after sustained growing conditions, such as a partial reduction in the initial response to elevated carbon dioxide. . Higher is not better. It is more expensive, and it widens your exposure risk.
- Tapering and terpenes Terpene A member of a large class of compounds built from isoprene units. Volatile terpenes contribute strongly to the aroma and flavor of cannabis. . We have not found published cannabis work testing whether a late taper changes terpene retention, in either direction. The taper is recommended here on cost, and on the fact that plants entering senescence Senescence The natural winding-down at the end of a plant's life cycle, when nitrogen moves out of the leaves and chlorophyll breaks down. assimilate less carbon.
That is where the literature stands as of August 2026, as far as we can find it. One well-run dose-response trial above 750 ppm would settle the setpoint question. If there is published work we have missed, or you have replicated data of your own, send it over and we will update this section.
Sourcing the gas
Sizing starts from what a room consumes. A 40 by 20 ft flower room holds about 226 m³ over 74 m² of canopy. Lifting it from 420 to 1,200 ppm takes about 318 g of CO₂, which feels like the answer but is not, because the canopy then fixes carbon all day long. Two independent estimates, one from canopy assimilation rate and one from the carbon content of the biomass you harvest, put daily uptake between roughly 1.8 and 2.8 kg. That is the number a source has to meet, before accounting for leakage.
A 50 lb cylinder holds 22.7 kg, so about nine days at 2.5 kg per day, and bulk liquid scales that up without changing anything else. Capacity is not what you are buying. A regulator and controller hold a setpoint and shut off at lights out, and that is what a commercial room needs.
Safety
OSHA's permissible exposure limit is 5,000 ppm as an eight hour time weighted average, so a 1,200 ppm setpoint is nowhere near dangerous in normal operation.
Normal operation is not the scenario worth designing for. A failed regulator or a stuck solenoid in a sealed room with someone working inside it is. Whatever the source, that case is the one that justifies hardwired monitors with audible alarms and a written evacuation protocol.
References
- Chandra, S., Lata, H., Khan, I. A., & ElSohly, M. A. (2008). Photosynthetic response of Cannabis sativa L. to variations in photosynthetic photon flux densities, temperature and CO₂ conditions. Physiology and Molecular Biology of Plants, 14(4), 299–306. https://doi.org/10.1007/s12298-008-0027-x
- Cockson, P., Landis, H., Smith, T., Hicks, K., & Whipker, B. E. (2019). Characterization of nutrient disorders of Cannabis sativa. Applied Sciences, 9(20), 4432. https://doi.org/10.3390/app9204432
- Dusenge, M. E., Duarte, A. G., & Way, D. A. (2019). Plant carbon metabolism and climate change: elevated CO₂ and temperature impacts on photosynthesis, photorespiration and respiration. New Phytologist, 221(1), 32–49. https://doi.org/10.1111/nph.15283
- Llewellyn, D., Golem, S., Jones, A. M. P., & Zheng, Y. (2023). Foliar symptomology, nutrient content, yield, and secondary metabolite variability of cannabis grown hydroponically with different single-element nutrient deficiencies. Plants, 12(3), 422. https://doi.org/10.3390/plants12030422
- Mahmoud, M., BenRejeb, I., Punja, Z. K., Buirs, L., & Jabaji, S. (2023). Understanding bud rot development, caused by Botrytis cinerea, on cannabis (Cannabis sativa L.) plants grown under greenhouse conditions [review]. Botany, 101(7), 200–231. https://doi.org/10.1139/cjb-2022-0139
- Occupational Safety and Health Administration. Annotated PELs, Table Z-1. https://www.osha.gov/annotated-pels/table-z-1
- Yamori, W., Irving, L. J., Adachi, S., & Busch, F. (2016). Strategies for optimizing photosynthesis with biotechnology to improve crop yield. In Handbook of Photosynthesis. Routledge. http://hdl.handle.net/1885/214070
Northwest Local Cannabis nw-local.com/blog/co2-enrichment-in-commercial-cannabis